Task 1
考试日期: | 2013.03.02 |
类别 | Pie Chart |
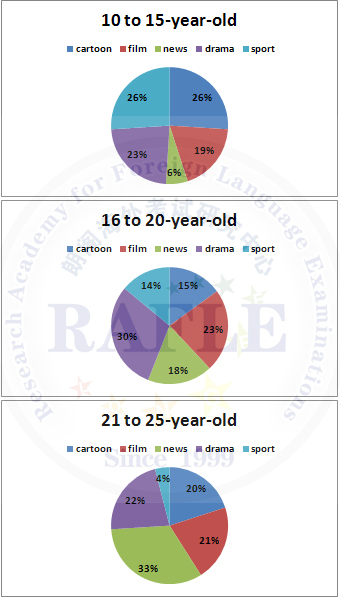
题目 | The pie charts show the TV programs enjoyed by people of different age groups. Summarize the information by selecting and reporting the main features, and make comparisons where relevant. |
题目翻译 | 这三个饼图描述了不同年龄段的人群喜欢的电视节目。 |
要素回忆(图表仅供参考):  | |
写作指导 | 1. 注意同一饼图下的排序。 2. 注意不同饼图之间同一电视节目比例的比较。 |
重点表达式 | 1. While, however, in spite of, in stark contrast等连词; 2. The preference for TV programs barely changes across different age groups. |
题目评价 | 难度一般 |
推荐练习 | 2007年8月Task one考题: The charts below show the US spending patterns from 1966 to 1996. Summarize the information by selecting and reporting the main features, and make comparisons where relevant. |
近期考试趋势 | 请考生注意表格和线图。 |