Jquery 实现动态的条形统计图
页面布局如下:
<html xmlns="http://www.w3.org/1999/xhtml"><head runat="server"> <title></title> <style type="text/css"> * { margin: 0 0 0 0; padding: 0 0 0 0; } .container { width: 300; height: 300; margin: 50 0 0 50; border: 1px solid green; float: left; background-image: url('/images/mubk.jpg'); } .control { width: 280; height: 80; float: left; margin: 50 0 0 10; border: 1 solid #000000; } .item { height: 98%; width: 30px; border: 1 sollid green; background-color: #191970; display: inline-block; display: inline; margin-left: 10px; margin-top: 10px; text-align: center; } </style> <script src="Scripts/jquery-1.4.1.js" type="text/javascript"></script> <script type="text/javascript"> $(function () { var timer1; $("#slide>div:odd").css({ 'background-color': '#308014' }); $("#slide>div:even").css({ 'background-color': '#4169e1' }); $("#bnt2").click(function () { timer1 = setInterval(initDance, 500); }); $("#btn1").click(function () { timer1 && clearInterval(timer1); }); }); function initDance() { var height = parseInt(280 * Math.random()) + 5; var box = parseInt(7 * Math.random()); dance(box, height); } function dance(box, height) { if (height) { $(".item").eq(box).css({ height: height }); var obj = {}; obj["box"] = box; obj["height"] = height; return obj; } else { return {}; } } </script></head><body> <div id="slide" class="container"> <div class="item"> 1 </div> <div class="item"> 2 </div> <div class="item"> 3 </div> <div class="item"> 4 </div> <div class="item"> 5 </div> <div class="item"> 6 </div> <div class="item"> 7 </div> <div class="item" style="width: 1; border: 0; background-color: White"> </div> </div> <div class="control"> <p style="display: none; position: relative"> 这是一个段落标记</p> <input type="button" value="停下来" id="btn1" /> <input type="button" value="跳起来" id="bnt2" /> </div></body></html>
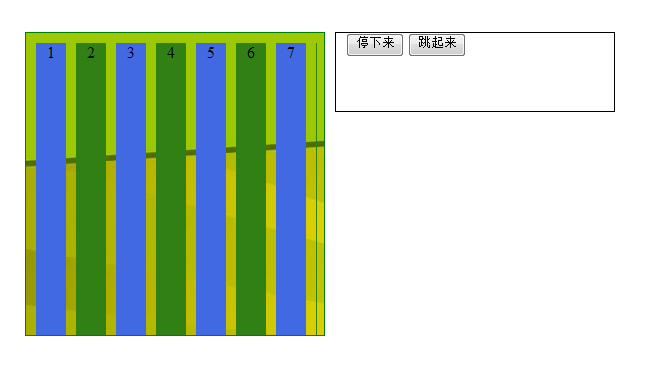
运行效果图:

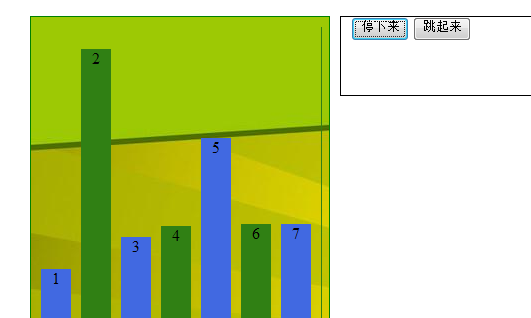
点击跳起来按钮效果:
