smartgwt绘制graph
在有些情况下,网页制作者会有需要用到“绘制图表”功能,smartgwtee提供了一组优秀的 graph控件 供使用者快速画出好看的图表。
首先,值得注意的是,并非所有版本的smartgwt都提供了graph功能,免费版(LGPL)并不提供,此外的Full-featured、Pro、Power、Enterprise版本都有提供,具体可参考SmartClient官网上的产品介绍页http://www.smartclient.com/product/
现在,在了解各版本支持功能后,在官网上下载60天试用smartgwtee版本(3.1),下载地址:http://www.smartclient.com/product/download-bounce.jsp?product=smartgwt&license=eval&version=3.1 下载前需要注册!
1. 下载后,准备好smartgwt所需的开发环境(eclipse + 所需插件)
2. 打开eclipse,建立一个新项目,比如:TestChart.接着将下载好的 smartgwtee-3.1.zip 解压缩,打开里面的lib文件夹,将所有的库文件复制粘贴到 TestChart 项目的war/WEB-INF/lib下(注意:eclipse中需要手动导入库文件,导入方式: 在eclipse中右键工程名字TestChart -> Properties -> Java Build Path -> Libraries -> Add JARs -> 选择TestChart/war/WEB-INF/lib -> 选择刚才复制进去的所有jar包)
3. 更新工程TestChart/src/com.example.myproject/modulename.gwt.xml(斜体部分为你在创建工程时所定义的)文件,添加如下语句:
? ? 2)项目入口函数 TestChart.java
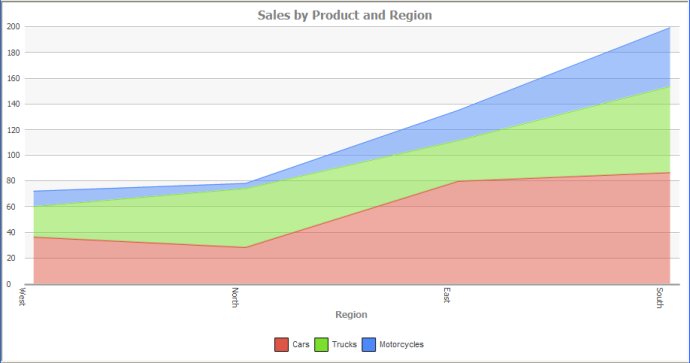
public class TestChart implements EntryPoint { @Override public void onModuleLoad() { // Create your own record class class SalesRecord extends Record { SalesRecord(String region, String product, Integer sales) { setAttribute("region", region); setAttribute("product", product); setAttribute("sales", sales); } } // Add your test records Record[] chartData = new Record[] { new SalesRecord("West", "Cars", 37), new SalesRecord("North", "Cars", 29), new SalesRecord("East", "Cars", 80), new SalesRecord("South", "Cars", 87), new SalesRecord("West", "Trucks", 23), new SalesRecord("North", "Trucks", 45), new SalesRecord("East", "Trucks", 32), new SalesRecord("South", "Trucks", 67), new SalesRecord("West", "Motorcycles", 12), new SalesRecord("North", "Motorcycles", 4), new SalesRecord("East", "Motorcycles", 23), new SalesRecord("South", "Motorcycles", 45) }; // Create the chart object final FacetChart simpleChart = new FacetChart(); // Create chart params, here is "region" and "product". Names are the same as defined // class constructor's params Facet regionFacet = new Facet("region", "Region"); Facet productFacet = new Facet("product", "Product"); simpleChart.setFacets(regionFacet, productFacet); // Set chart data simpleChart.setData(chartData); simpleChart.setValueProperty("sales"); // Set chart presentation type simpleChart.setChartType(ChartType.AREA); simpleChart.setTitle("Sales by Product and Region"); // Overall layout VLayout simpleChartLayout = new VLayout(); simpleChartLayout.setWidth100(); simpleChartLayout.setHeight100(); simpleChartLayout.setMembersMargin(20); // Add chart to the layout simpleChartLayout.setMembers(simpleChart); simpleChartLayout.draw(); }}?
c) 最后看下执行效果吧~
(当然,还有其他类型的图标,可通过simpleChart.setChartType(ChartType.*)设置)

?
与smartgwtee相关的其他安装参数可参考:http://www.smartclient.com/smartgwtee/javadoc/com/smartgwt/client/docs/SgwtEESetup.html
?