JFreeChart开发Web图形报表(饼状图)
?首先关于本文环境配置请查看上一篇JFreeChart开发Web图形报表(柱状图),本文都是在其环境配置基础之上。
?
三.?? 饼图
在JFreeChart中,与饼图绘制密切相关的类如下:
1) DefaultPieDataset
????? 默认的饼图数据集类,用来存储饼图显示的相关数据信息。例如:
?
//设置饼图数据集DefaultPieDataset dataset = new DefaultPieDataset();dataset.setValue("黑心矿难", 720);dataset.setValue("醉酒驾驶", 530);dataset.setValue("城管强拆", 210);dataset.setValue("医疗事故", 91);dataset.setValue("其他", 66);??????? 2) PiePlot
??????????? 饼图绘制类,可以用来设置饼图的相关属性。例如:
?
PiePlot pieplot = (PiePlot) chart.getPlot();pieplot.setLabelFont(new Font("宋体", 0, 11));//设置饼图是圆的(true),还是椭圆的(false);默认为truepieplot.setCircular(true);//没有数据的时候显示的内容pieplot.setNoDataMessage("无数据显示");pieplot.setLabelGap(0.02D);?????????3) ChartFactory
???????? 可利用该制图工厂类createPieChart来创建一个饼图的JFreeChart对象,例如:
JFreeChart chart = ChartFactory.createPieChart("非正常死亡人数分布图", dataset, true, true, false);?
?下面让我们看一个简单的例子,新建pie1.jsp的内容如下:
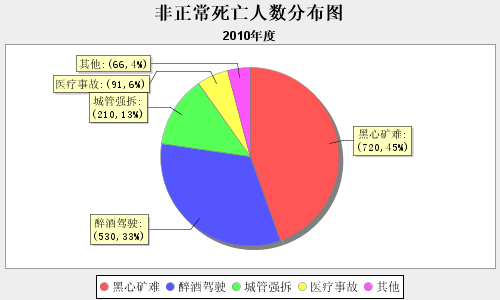
<%@ page contentType="text/html;charset=GBK"%><%@ page import="org.jfree.chart.*,org.jfree.chart.plot.PiePlot,org.jfree.chart.title.TextTitle,org.jfree.chart.labels.*,org.jfree.data.general.DefaultPieDataset,org.jfree.chart.servlet.ServletUtilities,java.awt.*,java.text.NumberFormat"%><%//设置饼图数据集DefaultPieDataset dataset = new DefaultPieDataset();dataset.setValue("黑心矿难", 720);dataset.setValue("醉酒驾驶", 530);dataset.setValue("城管强拆", 210);dataset.setValue("医疗事故", 91);dataset.setValue("其他", 66);//通过工厂类生成JFreeChart对象JFreeChart chart = ChartFactory.createPieChart("非正常死亡人数分布图", dataset, true, true, false);//加个副标题chart.addSubtitle(new TextTitle("2010年度"));PiePlot pieplot = (PiePlot) chart.getPlot();pieplot.setLabelFont(new Font("宋体", 0, 11));//设置饼图是圆的(true),还是椭圆的(false);默认为truepieplot.setCircular(true);StandardPieSectionLabelGenerator standarPieIG = new StandardPieSectionLabelGenerator("{0}:({1},{2})", NumberFormat.getNumberInstance(), NumberFormat.getPercentInstance());pieplot.setLabelGenerator(standarPieIG);//没有数据的时候显示的内容pieplot.setNoDataMessage("无数据显示");pieplot.setLabelGap(0.02D);String filename = ServletUtilities.saveChartAsPNG(chart, 500, 300, null, session);String graphURL = request.getContextPath() + "/DisplayChart?filename=" + filename;%><img src="<%= graphURL %>" width=490 height=306 border=0 >?运行pie1.jsp,效果如下:

这个很简单。程序中的注解说的也很详细。不多说了。
在看一个3D通明效果的例子:pie2.jsp页面如下:
<%@ page contentType="text/html;charset=GBK"%><%@ page import="org.jfree.chart.*,org.jfree.chart.plot.PiePlot,org.jfree.chart.title.TextTitle,org.jfree.chart.labels.*,org.jfree.data.general.DefaultPieDataset,org.jfree.chart.servlet.ServletUtilities,java.awt.*,java.text.NumberFormat,org.jfree.chart.plot.PiePlot3D,org.jfree.util.Rotation"%><%//设置饼图数据集DefaultPieDataset dataset = new DefaultPieDataset();dataset.setValue("黑心矿难", 720);dataset.setValue("醉酒驾驶", 530);dataset.setValue("城管强拆", 210);dataset.setValue("医疗事故", 91);dataset.setValue("其他", 66);//通过工厂类生成JFreeChart对象JFreeChart chart = ChartFactory.createPieChart3D("非正常死亡人数分布图", dataset, true, true, false);chart.addSubtitle(new TextTitle("2010年度"));PiePlot pieplot = (PiePlot) chart.getPlot();pieplot.setLabelFont(new Font("宋体", 0, 11));StandardPieSectionLabelGenerator standarPieIG = new StandardPieSectionLabelGenerator("{0}:({1},{2})", NumberFormat.getNumberInstance(), NumberFormat.getPercentInstance());pieplot.setLabelGenerator(standarPieIG);//没有数据的时候显示的内容pieplot.setNoDataMessage("无数据显示");pieplot.setLabelGap(0.02D);PiePlot3D pieplot3d = (PiePlot3D)chart.getPlot();//设置开始角度pieplot3d.setStartAngle(120D);//设置方向为”顺时针方向“pieplot3d.setDirection(Rotation.CLOCKWISE);//设置透明度,0.5F为半透明,1为不透明,0为全透明pieplot3d.setForegroundAlpha(0.7F);String filename = ServletUtilities.saveChartAsPNG(chart, 500, 300, null, session);String graphURL = request.getContextPath() + "/DisplayChart?filename=" + filename;%><img src="<%= graphURL %>" width=490 height=306 border=0 >?运行pie2.jsp页面效果如下:

?
有时我们想突出某一个来显示,需要加入下面一句:
//第一个参数是key,第二个参数是突出显示的大小(可以自己调整一下看看效果就明白了)pieplot.setExplodePercent("城管强拆",0.23);?运行效果如下:

?
饼图的主要就这些了。
声明:JFreeChart版本修订过程中,类结构会出现很大的变化,本文只针对JFreeChart-1.0.10.jar
??????本文数据不具任何法律效应,只是作者学习测试用。