Canvas学习笔记(二)--绘图(矩形)
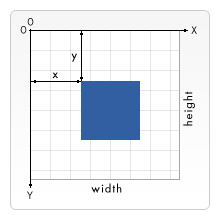
1、canvas网格坐标

?左上角为坐标原点(0,0),横轴X向右坐标值增大,纵轴Y向下坐标值增大。坐标系中所有物体的位置都相对于这个原点。如图所示,蓝色方块的位置距左边x像素,距上面y像素,坐标为(x,y)。
?
2、绘制矩形
?
fillRect(x,y,width,height):绘制填充颜色的矩形;
?
strokeRect(x,y,width,height):绘制带有边框的矩形;
?
clearRect(x,y,width,height):清空绘制的矩形区域,并使之透明;
?
参数的含义:
?
X:横坐标的位置;
y:纵坐标的位置;
width:矩形的宽度;
height:矩形的高度;
?
X,Y表示矩形左上角相对于原点(0,0)的位置。
?
矩形演示代码如下:
?
?
<!DOCTYPE html PUBLIC "-//W3C//DTD XHTML 1.0 Transitional//EN" "http://www.w3.org/TR/xhtml1/DTD/xhtml1-transitional.dtd"><html xmlns="http://www.w3.org/1999/xhtml"> <head> <style type="text/css">.wraper {position: relative;border: 1px solid orange;} </style><script type="text/javascript">function draw(){var canvas = document.getElementById('test'); if(canvas.getContext){var cxt = canvas.getContext('2d');cxt.fillRect(5,5,100,100);cxt.clearRect(20,20,50,50);cxt.strokeRect(120,120,70,70);}}</script> </head> <body onload="draw();"><canvas id="test" width="200px" height="200px" src="/img/2012/06/25/18205412942.png">?
?
?