用Struts2生成Open Flash Chart 2图表数据准备以下开源项目:1. Struts 2.1.62. Open Flash Chart 2 Versio
用Struts2生成Open Flash Chart 2图表数据
准备以下开源项目:
1. Struts 2.1.6
2. Open Flash Chart 2 Version 2 Lug Wyrm Charmer (28th, July 2009)
3. jofc2,这东西不知道是没做好还是什么意思,好像和ofc2不怎么匹配,最好下源码,有什么问题直接改。
4. log4j
用eclipse新建动态网站,取名OFC2Demo,将Struts2 lib目录下commons-fileupload-1.2.1.jar、commons-logging-1.0.4.jar、freemarker-2.3.13.jar、ognl-2.6.11.jar、struts2-core-2.1.6.jar、xstream-1.3.1.jar和xwork-2.1.2.jar、log4j.jar复制到WebContent\lib目录下。
使用svn下载jofc2源码,http://jofc2.googlecode.com/svn/trunk/,将下载后的src目录下的jofc2整个目录和下级内容全部复制到项目src目录下。
在web.xml中加入struts2拦截器
<!--<br /><br />Code highlighting produced by Actipro CodeHighlighter (freeware)<br />http://www.CodeHighlighter.com/<br /><br />--><?xml?version="1.0"?encoding="UTF-8"?>
<web-app?xmlns:xsi="http://www.w3.org/2001/XMLSchema-instance"?xmlns="http://java.sun.com/xml/ns/javaee"?xmlns:web="http://java.sun.com/xml/ns/javaee/web-app_2_5.xsd"?xsi:schemaLocation="http://java.sun.com/xml/ns/javaee?http://java.sun.com/xml/ns/javaee/web-app_2_5.xsd"?id="WebApp_ID"?version="2.5">
??<display-name>OFC2Demo</display-name>
??<filter>
????<filter-name>struts2</filter-name>
????<filter-class>
??????org.apache.struts2.dispatcher.FilterDispatcher
????</filter-class>
??</filter>
??<filter-mapping>
????<filter-name>struts2</filter-name>
????<url-pattern>/*</url-pattern>
??</filter-mapping>
??<welcome-file-list>
????<welcome-file>index.html</welcome-file>
????<welcome-file>index.htm</welcome-file>
????<welcome-file>index.jsp</welcome-file>
????<welcome-file>default.html</welcome-file>
????<welcome-file>default.htm</welcome-file>
????<welcome-file>default.jsp</welcome-file>
??</welcome-file-list>
</web-app>
在返回jofc2生成Open Flash Chart数据时,本来想用jsonplugin插件,但发现序列化jofc2的Chart对象时,许多元素名称和Chart.toString()不同,这使得Open Flash Chart解析数据时不认识。所以需增加一个Struts2自定义Result Type,步骤如下:
新建类,OFC2Plugin
<!--<br /><br />Code highlighting produced by Actipro CodeHighlighter (freeware)<br />http://www.CodeHighlighter.com/<br /><br />-->package?com.xy.strutsplugin;
import?java.io.IOException;
import?java.io.PrintWriter;
import?javax.servlet.http.HttpServletResponse;
import?jofc2.model.Chart;
import?org.apache.commons.logging.Log;
import?org.apache.commons.logging.LogFactory;
import?org.apache.struts2.StrutsStatics;
import?com.opensymphony.xwork2.ActionContext;
import?com.opensymphony.xwork2.ActionInvocation;
import?com.opensymphony.xwork2.Result;
import?com.opensymphony.xwork2.util.ValueStack;
public?class?OFC2Result implements?Result?{
????private?static?final?long?serialVersionUID?=?6881760833309063964L;
????private?static?final?Log?log?=?LogFactory.getLog(OFC2Result.class);
????public?void?execute(ActionInvocation?invocation)?throws?Exception?{
????????ActionContext?actionContext?=?invocation.getInvocationContext();
????????HttpServletResponse?response?=?(HttpServletResponse)?actionContext
????????????????.get(StrutsStatics.HTTP_RESPONSE);
????????
????????try?{
????????????ValueStack?stack?=?invocation.getStack();
????????????Chart?chart?=?(Chart)stack.findValue("ofcChart");
????????????
????????????response.setContentType("application/json-rpc;charset=utf-8");
????????????response.setHeader("Cache-Control",?"no-cache");
????????????response.setHeader("Expires",?"0");
????????????response.setHeader("Pragma",?"No-cache");
????????????
????????????PrintWriter?out?=?response.getWriter();
????????????log.debug(chart.toString());
????????????out.print(chart.toString());
????????}?catch?(IOException?exception)?{
????????????log.error(exception.getMessage(),?exception);
????????????throw?exception;
????????}
????}
}
在src下新建struts-plugin.xml
<!--<br /><br />Code highlighting produced by Actipro CodeHighlighter (freeware)<br />http://www.CodeHighlighter.com/<br /><br />--><?xml?version="1.0"?encoding="UTF-8"??>
<!DOCTYPE?struts?PUBLIC
????????"-//Apache?Software?Foundation//DTD?Struts?Configuration?2.0//EN"
????????"http://struts.apache.org/dtds/struts-2.0.dtd">
<struts>
????<package?name="ofc2-default"?extends="struts-default">
????????<result-types>
????????????<result-type?name="ofc2"?class="com.xy.strutsplugin.OFC2Result"/>
????????</result-types>
????</package>
</struts>
配置log4j,以查看json输出信息。
在src下增加两个文件
commons-logging.properties
<!--<br /><br />Code highlighting produced by Actipro CodeHighlighter (freeware)<br />http://www.CodeHighlighter.com/<br /><br />-->##?set?Log?as?Log4j
org.apache.commons.logging.Log=org.apache.commons.logging.impl.Log4JLogger
log4j.properties
<!--<br /><br />Code highlighting produced by Actipro CodeHighlighter (freeware)<br />http://www.CodeHighlighter.com/<br /><br />-->#?This?is?the?configuring?for?logging?displayed?in?the?Application?Server
log4j.rootCategory=DEBUG,stdout
#stdout?configure
log4j.appender.stdout=org.apache.log4j.ConsoleAppender
log4j.appender.stdout.layout=org.apache.log4j.PatternLayout
log4j.appender.stdout.layout.ConversionPattern=?%d?%p?[%c]?-?<%m>%n
##
log4j.logger.com.xy.strutsplugin.OFC2Result=DEBUG
好了,现在将ofc所需的包添加到项目中
在WebContent目录下添加文件夹ofc2,将open-flash-chart-2-Lug-Wyrm-Charmer目录下的open-flash-chart.swf和js目录复制到新建的ofc2目录下。
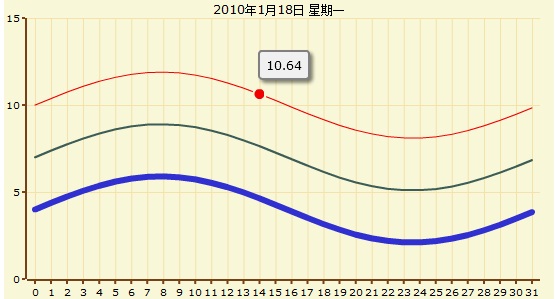
演示Line Chart
在Action层增加类LineAction
<!--<br /><br />Code highlighting produced by Actipro CodeHighlighter (freeware)<br />http://www.CodeHighlighter.com/<br /><br />-->package?com.xy.action;
import?java.text.DateFormat;
import?java.util.ArrayList;
import?java.util.Date;
import?java.util.List;
import?java.util.Locale;
import?jofc2.model.Chart;
import?jofc2.model.elements.LineChart;
import?jofc2.model.axis.YAxis;
import?jofc2.model.Text;
import?com.opensymphony.xwork2.ActionSupport;
public?class?LineAction?extends?ActionSupport{
????private?static?final?long?serialVersionUID?=?-5759373192727732648L;
????
????private?Chart?ofcChart;
????public?Chart?getOfcChart()?{
????????return?ofcChart;
????}
????
????public?String?dot(){
????????List<LineChart.Dot>?data1=new?ArrayList<LineChart.Dot>()
????????????????,?data2=new?ArrayList<LineChart.Dot>()
????????????????,?data3=new?ArrayList<LineChart.Dot>();
????????for(double?i=0;i<6.2;i+=0.2){
????????????//?line?1?dot
????????????LineChart.Dot?dot1?=?new?LineChart.Dot(Math.sin(i)*1.9+10);
????????????dot1.setDotSize(5);????????????//?点大小
????????????dot1.setColour("#f00000");????//?设置点颜色
????????????data1.add(dot1);
????????????
????????????//?line?2?dot
????????????LineChart.Dot?dot2?=?new?LineChart.Dot(Math.sin(i)*1.9+7);
????????????dot2.setDotSize(3);
????????????dot2.setHaloSize(1);????????//?点外空白大小
????????????dot2.setColour("#3D5C56");
????????????data2.add(dot2);
????????????
????????????//?line?3?dot
????????????LineChart.Dot?dot3?=?new?LineChart.Dot(Math.sin(i)*1.9+4);
????????????dot3.setDotSize(4);
????????????dot3.setHaloSize(2);
????????????data3.add(dot3);
????????}
????????
????????Date?date?=?new?Date();
????????Locale?locale?=?new?Locale("zh","CN");
????????DateFormat?dateFormat?=?DateFormat.getDateInstance(DateFormat.FULL,?locale);
????????
????????//?line?1
????????LineChart?line1?=?new?LineChart();
????????line1.setDotStyle(new?LineChart.Style(LineChart.Style.Type.DOT));
????????line1.setWidth(1);????????????//?线宽
????????line1.addDots(data1);????????//?增加数据
????????
????????//?line?2
????????LineChart?line2?=?new?LineChart();
????????line2.setDotStyle(new?LineChart.Style(LineChart.Style.Type.DOT));
????????line2.setColour("#3D5C56");
????????line2.setWidth(2);
????????line2.addDots(data2);
????????
????????//?line3
????????LineChart?line3?=?new?LineChart();
????????line3.setDotStyle(new?LineChart.Style(LineChart.Style.Type.DOT));
????????line3.setWidth(6);
????????line3.addDots(data3);
????????
????????YAxis?y?=?new?YAxis();
????????y.setRange(0,?15,?5);????????//?设置Y柚范围,参数依次为最小值、最大值、间隔
????????ofcChart?=?new?Chart();
????????ofcChart.setTitle(new?Text(dateFormat.format(date)));????//?设置标题
????????ofcChart.addElements(line1);????????????????????????????//?增加线到图表
????????ofcChart.addElements(line2);
????????ofcChart.addElements(line3);
????????ofcChart.setYAxis(y);????????????????????????????????????//?设置Y柚
????????
????????return?SUCCESS;
????}
}
增加struts配置文件
<!--<br /><br />Code highlighting produced by Actipro CodeHighlighter (freeware)<br />http://www.CodeHighlighter.com/<br /><br />--><?xml?version="1.0"?encoding="UTF-8"?>
<!DOCTYPE?struts?PUBLIC
????????"-//Apache?Software?Foundation//DTD?Struts?Configuration?2.0//EN"
????????"http://struts.apache.org/dtds/struts-2.0.dtd">
<struts>
????<package?name="ofc2"?extends="ofc2-default">
???????<action?name="line"?class="com.xy.action.LineAction">
?????????<result?type="ofc2"/>
???????</action>
????</package>
</struts>
在WebContent目录下增加line目录,目录下增加dot.html,对应官方示例Line Dot,dot.html内容如下:
<!--<br /><br />Code highlighting produced by Actipro CodeHighlighter (freeware)<br />http://www.CodeHighlighter.com/<br /><br />--><!DOCTYPE?html?PUBLIC?"-//W3C//DTD?HTML?4.01?Transitional//EN"?"http://www.w3.org/TR/html4/loose.dtd">
<html>
<head>
<meta?http-equiv="Content-Type"?content="text/html;?charset=UTF-8">
<title>Line?Dot</title>
<script?type="text/javascript"?src="../jquery/jquery.js"></script>
<script?type="text/javascript"?src="../ofc2/js/swfobject.js"></script>
<script?type="text/javascript"?language="javascript">
????$(document).ready(function(){
????????swfobject.embedSWF("../ofc2/open-flash-chart.swf",?
????????????????????"chart",?"550",?"300",?"9.0.0",
????????????????????"expressInstall.swf",
????????????????????{"data-file":"line!dot"});
????});
</script>?
</head>
<body>
????<div?id="chart"></div>
</body>
</html>
这里用到了一点jquery的东西,请把jquery的包增加到相应目录下。
运行Tomcat,浏览器输入http://localhost:8080/OFC2Demo/line/dot.html,出下如下图表