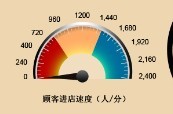
highcharts怎么样实现这样的?
由于页面需要,highcharts怎么样实现这样的东西.
highcharts示例里头有个vu meter的.
但不知道怎么弄?或者有更好的示例,大家说说.谢谢了.
[解决办法]
html部分:
/**
 * Grid theme for Highcharts JS
 * @author Torstein H?nsi
 */

Highcharts.theme = {
   colors: ['#058DC7', '#50B432', '#ED561B', '#DDDF00', '#24CBE5', '#64E572', '#FF9655', '#FFF263', '#6AF9C4'],
   chart: {
      backgroundColor: {
         linearGradient: { x1: 0, y1: 0, x2: 1, y2: 1 },
         stops: [
            [0, 'rgb(255, 255, 255)'],
            [1, 'rgb(240, 240, 255)']
         ]
      },
      borderWidth: 2,
      plotBackgroundColor: 'rgba(255, 255, 255, .9)',
      plotShadow: true,
      plotBorderWidth: 1
   },
   title: {
      style: {
         color: '#000',
         font: 'bold 16px "Trebuchet MS", Verdana, sans-serif'
      }
   },
   subtitle: {
      style: {
         color: '#666666',
         font: 'bold 12px "Trebuchet MS", Verdana, sans-serif'
      }
   },
   xAxis: {
      gridLineWidth: 1,
      lineColor: '#000',
      tickColor: '#000',
      labels: {
         style: {
            color: '#000',
            font: '11px Trebuchet MS, Verdana, sans-serif'
         }
      },
      title: {
         style: {
            color: '#333',
            fontWeight: 'bold',
            fontSize: '12px',
            fontFamily: 'Trebuchet MS, Verdana, sans-serif'

         }
      }
   },
   yAxis: {
      minorTickInterval: 'auto',
      lineColor: '#000',
      lineWidth: 1,
      tickWidth: 1,
      tickColor: '#000',
      labels: {
         style: {
            color: '#000',
            font: '11px Trebuchet MS, Verdana, sans-serif'
         }
      },
      title: {
         style: {
            color: '#333',
            fontWeight: 'bold',
            fontSize: '12px',
            fontFamily: 'Trebuchet MS, Verdana, sans-serif'
         }
      }
   },
   legend: {
      itemStyle: {
         font: '9pt Trebuchet MS, Verdana, sans-serif',
         color: 'black'

      },
      itemHoverStyle: {
         color: '#039'
      },
      itemHiddenStyle: {
         color: 'gray'
      }
   },
   labels: {
      style: {
         color: '#99b'
      }
   },

   navigation: {
      buttonOptions: {
         theme: {
            stroke: '#CCCCCC'
         }
      }
   }
};

// Apply the theme
var highchartsOptions = Highcharts.setOptions(Highcharts.theme);
$(function () {
$('#container').highcharts({

    chart: {
        type: 'gauge',
        plotBorderWidth: 1,
        plotBackgroundColor: {
        linearGradient: { x1: 0, y1: 0, x2: 0, y2: 1 },
        stops: [
        [0, '#FFF4C6'],
        [0.3, '#FFFFFF'],
        [1, '#FFF4C6']
        ]
        },
        plotBackgroundImage: null,
        height: 200
    },

    title: {
        text: 'VU meter'
    },

    pane: [{
        startAngle: -45,
        endAngle: 45,
        background: null,
        center: ['25%', '145%'],
        size: 300
    }, {
    startAngle: -45,
    endAngle: 45,
    background: null,
        center: ['75%', '145%'],
        size: 300
    }],

    yAxis: [{
        min: -20,
        max: 6,
        minorTickPosition: 'outside',
        tickPosition: 'outside',
        labels: {
        rotation: 'auto',
        distance: 20
        },
        plotBands: [{
        from: 0,
        to: 6,
        color: '#C02316',
        innerRadius: '100%',
        outerRadius: '105%'
        }],
        pane: 0,
        title: {
        text: 'VU<br/><span style="font-size:8px">Channel A</span>',
        y: -40
        }
    }, {
        min: -20,
        max: 6,
        minorTickPosition: 'outside',
        tickPosition: 'outside',
        labels: {
        rotation: 'auto',
        distance: 20
        },
        plotBands: [{
        from: 0,
        to: 6,
        color: '#C02316',
        innerRadius: '100%',
        outerRadius: '105%'
        }],
        pane: 1,
        title: {
        text: 'VU<br/><span style="font-size:8px">Channel B</span>',
        y: -40
        }
    }],

    plotOptions: {
    gauge: {
    dataLabels: {
    enabled: false
    },
    dial: {
    radius: '100%'
    }
    }
    },


    series: [{
        data: [-20],
        yAxis: 0
    }, {
        data: [-20],
        yAxis: 1
    }]

},

// Let the music play
function(chart) {
    setInterval(function() {
        var left = chart.series[0].points[0],
            right = chart.series[1].points[0],
            leftVal,
            inc = (Math.random() - 0.5) * 3;

        leftVal =  left.y + inc;
        rightVal = leftVal + inc / 3;
        if (leftVal < -20
[解决办法]
 leftVal > 6) {
            leftVal = left.y - inc;
        }
        if (rightVal < -20
[解决办法]
 rightVal > 6) {
            rightVal = leftVal;
        }

        left.update(leftVal, false);
        right.update(rightVal, false);
        chart.redraw();

    }, 500);

});
});