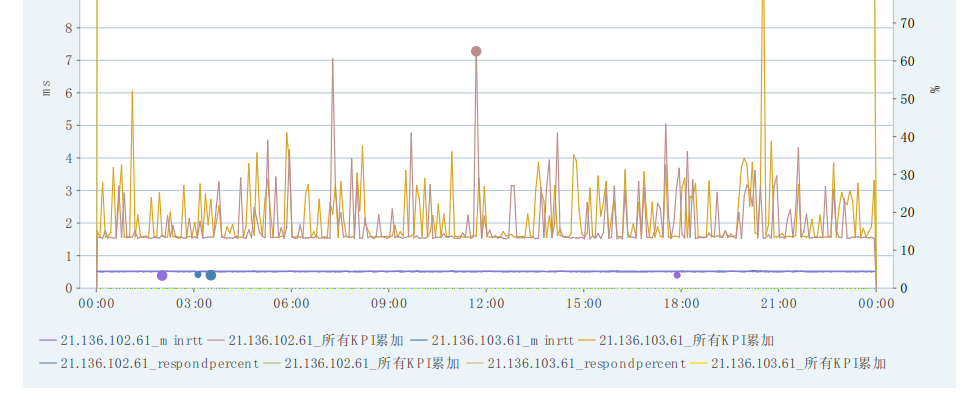
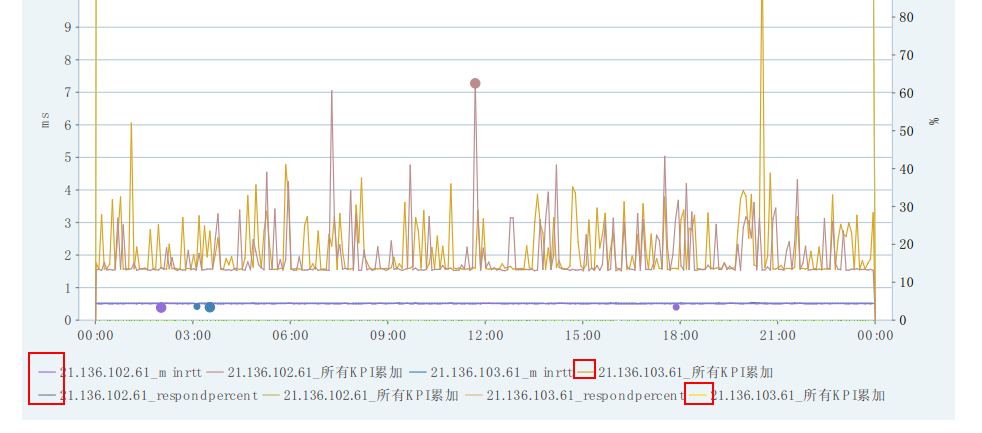
JFreeChart图例设置

这是用JfreeChart画出来的图表,其中我用红框框标注出来的图例,太小了,我想让它变大,加粗,成矩形或正方形的小图例,改怎么改,急急急....求助。
 jfreechart 图例
[解决办法]
/**
 * 柱状图
 * @param dataset
 * @param plot
 * @param width
 * @param height
 * @throws Exception
 */
public void pillar(DefaultCategoryDataset dataset, PlotOrientation plot, Integer width, Integer height) throws Exception {
JFreeChart chart = ChartFactory.createBarChart3D("", "", "", dataset, plot, true, true, true);
CategoryPlot plot1 = chart.getCategoryPlot();//获得图表区域对象
BarRenderer3D bar = (BarRenderer3D) plot1.getRenderer();
bar.setBaseItemLabelGenerator(new StandardCategoryItemLabelGenerator());//显示每个柱的数值
bar.setBaseItemLabelsVisible(true);
bar.setBasePositiveItemLabelPosition(new ItemLabelPosition(ItemLabelAnchor.OUTSIDE12, TextAnchor.BASELINE_CENTER));
bar.setItemLabelAnchorOffset(-12D);// 设置柱形图上的文字偏离值
if (height == 35) {
height = 135;
bar.setMaximumBarWidth(0.25);
bar.setItemMargin(0.000000005);
}
plot1.setRenderer(bar);
try {
NumberAxis axis = (NumberAxis) plot1.getRangeAxis();// y轴精度
axis.setAutoRangeIncludesZero(true);// 设置刻度必须从0开始
axis.setNumberFormatOverride(new DecimalFormat("#0"));
} catch (Exception e) {}
getResponse().setContentType("text/plain;charset=UTF-8");
ChartUtilities.writeChartAsPNG(getResponse().getOutputStream(), chart, width, height);
}

/**
 * 折线图
 * @param dataset
 * @param plot
 * @param width
 * @param height
 * @throws Exception
 */
public void line(DefaultCategoryDataset dataset, PlotOrientation plot, Integer width, Integer height) throws Exception {
JFreeChart chart = ChartFactory.createLineChart("", "", "", dataset, plot, true, true, true);
CategoryPlot plot1 = chart.getCategoryPlot();//获得图表区域对象
LineAndShapeRenderer renderer = new LineAndShapeRenderer();
//renderer.setSeriesPaint(0, Color.BLUE);// 改变折线的颜色
renderer.setBaseItemLabelGenerator(new StandardCategoryItemLabelGenerator());//显示每个柱的数值
renderer.setBaseItemLabelsVisible(true);
renderer.setBasePositiveItemLabelPosition(new ItemLabelPosition(ItemLabelAnchor.OUTSIDE12, TextAnchor.BASELINE_CENTER));
renderer.setItemLabelAnchorOffset(2D);// 设置柱形图上的文字偏离值
if (height == 35) {
height = 135;
}
plot1.setRenderer(renderer);// 给折线加点
try {
NumberAxis axis = (NumberAxis) plot1.getRangeAxis();// y轴精度
axis.setAutoRangeIncludesZero(true);// 设置刻度必须从0开始
axis.setNumberFormatOverride(new DecimalFormat("#0"));
} catch (Exception e) {}
getResponse().setContentType("text/plain;charset=UTF-8");
ChartUtilities.writeChartAsPNG(getResponse().getOutputStream(), chart, width, height);
}

/**
 * 饼图
 * @param dataset
 * @param width
 * @param height
 * @throws Exception
 */
public void round(DefaultPieDataset dataset, Integer width, Integer height) throws Exception {
JFreeChart chart = ChartFactory.createPieChart("", dataset, true, true, true);
PiePlot plot = (PiePlot) chart.getPlot();
plot.setLabelLinkMargin(0.1d);
plot.setLabelGenerator(new StandardPieSectionLabelGenerator("{2}", new DecimalFormat("0.00"), new DecimalFormat("0.00%")));
getResponse().setContentType("text/plain;charset=UTF-8");
ChartUtilities.writeChartAsPNG(getResponse().getOutputStream(), chart, width, height);
}