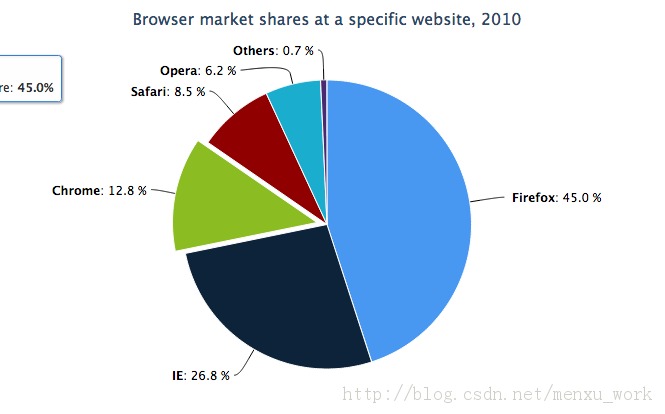
图表绘制 HTML5

应用:http://www.highcharts.com/demo/pie-basic
思路很不错
jQuery -> jQuery('.page-chart.all-courses-select-apply-pie').each -> $chart = jQuery(this) jQuery.ajax url: '/charts/courses/all_courses_select_apply_pie' success: (res)-> notfull = res.notfull over = res.over full = res.full empty = res.empty option = chart: plotBackgroundColor: null plotBorderWidth: null plotShadow: false backgroundColor: null title: text: null plotOptions: pie: allowPointSelect: false showInLegend: true cursor: 'pointer' series: [ { type: 'pie' name: '课程数' animation: false # point: # events: # click: (e)-> # location.href = "/manage/courses?select_apply_status=#{this.label}" dataLabels: format: '<b>{point.name}</b>: {point.y}' color: 'black' distance: 25 style: fontSize: '15px' fontWeight: 'bold' data: [ { label: 'notfull' name: '人数过少' y: notfull color: '#FEF093' }, { label: 'over' name: '人数过多' y: over color: '#cc3333' }, { label: 'full' name: '人数适合' y: full color: '#80CC00' }, { label: 'empty' name: '无人选' y: empty color: '#CDCDCD' }, ] } ] $chart.highcharts option